You are
Accountability Observatory
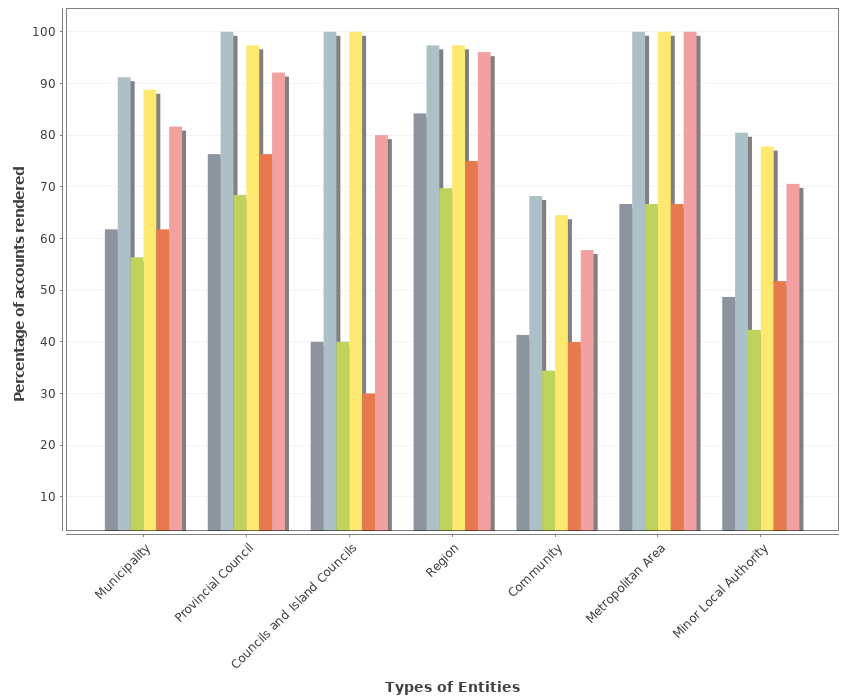
Evolution of the levels of accountability by type of entity.
| Â | Financial year 2022 | Financial year 2023 | Financial year 2024 | |||
|---|---|---|---|---|---|---|
| Local Entity Type | Up to 15/10 / | Up to date | Up to 15/10 / | Up to date | Up to 15/10 / | Up to date |
| Municipality | 56.35 % | 91.01 % | 61.77 % | 88.80 % | 60.94 % | 82.17 % |
| Provincial Council | 68.42 % | 100.00 % | 76.32 % | 94.74 % | 81.58 % | 92.11 % |
| Councils and Island Councils | 40.00 % | 100.00 % | 30.00 % | 100.00 % | 30.00 % | 90.00 % |
| Region | 69.74 % | 97.37 % | 75.00 % | 97.37 % | 69.74 % | 96.05 % |
| Community | 34.21 % | 66.27 % | 39.76 % | 63.61 % | 39.69 % | 56.45 % |
| Metropolitan Area | 66.67 % | 100.00 % | 66.67 % | 100.00 % | 66.67 % | 100.00 % |
| Total | 54.34 % | 88.70 % | 59.78 % | 86.48 % | 59.02 % | 79.86 % |
| Minor Local Authority | 42.29 % | 80.25 % | 51.72 % | 78.91 % | 61.70 % | 74.51 % |
Note: It does not include Entities from Navarra and Basque Country.