You are
Accountability Observatory
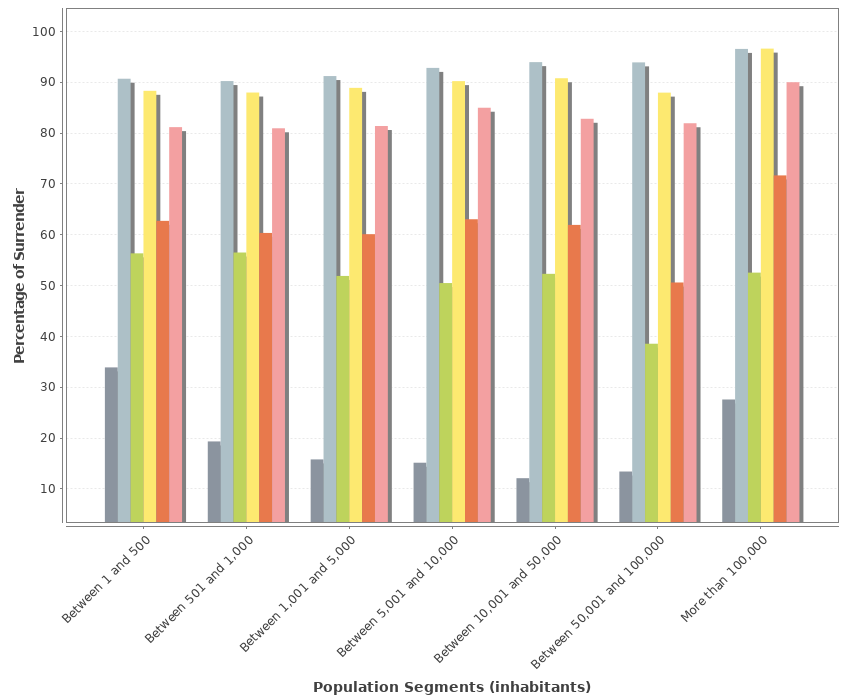
Evolution of the levels of accountability of local councils, by sections of population.
| Municipality | ||||||||
|---|---|---|---|---|---|---|---|---|
| 2022 | 2023 | 2024 | ||||||
| Population Segments (inhabitants) | Up to 15/10 / | Up to date | Up to 15/10 / | Up to date | Up to 15/10 / | Up to date | ||
| More than 100,000 | 52.54 % | 98.31 % | 71.67 % | 98.33 % | 71.67 % | 91.67 % | ||
| Between 50,001 and 100,000 | 38.55 % | 95.18 % | 50.60 % | 95.18 % | 60.24 % | 84.34 % | ||
| Between 10,001 and 50,000 | 52.30 % | 92.73 % | 61.93 % | 90.70 % | 58.79 % | 83.97 % | ||
| Between 5,001 and 10,000 | 50.49 % | 92.56 % | 63.04 % | 90.12 % | 60.83 % | 84.29 % | ||
| Between 1,001 and 5,000 | 51.89 % | 90.78 % | 60.11 % | 88.89 % | 58.58 % | 81.72 % | ||
| Between 501 and 1,000 | 56.50 % | 89.69 % | 60.35 % | 88.13 % | 61.30 % | 81.62 % | ||
| Between 1 and 500 | 56.34 % | 90.72 % | 62.72 % | 88.04 % | 62.13 % | 81.33 % | ||
Note: It does not include Entities from Navarra and Basque Country.
Note: It does not include Consortium and Minor local Entities.